You open GMGN to look at a token that has been climbing. People are posting screenshots of their gains, and someone says it could be the next big meme coin. Then you notice a few figures beside the chart: Insiders, Bundler and Top 10. You may have heard that lower percentages are better. But what do those percentages actually measure—and how much can they tell you?
Our article on what Chinese crypto traders mean by “jin gou” covered market cap, liquidity and volume. Here, we go a step further: who holds the tokens, how they acquired them and what they have done with them since.
On the token detail page, check the network and full token address first. The figures we are looking at sit below the trading controls on the right. Both screenshots show the same token in GMGN’s Chinese interface and are used to explain how to read the page.
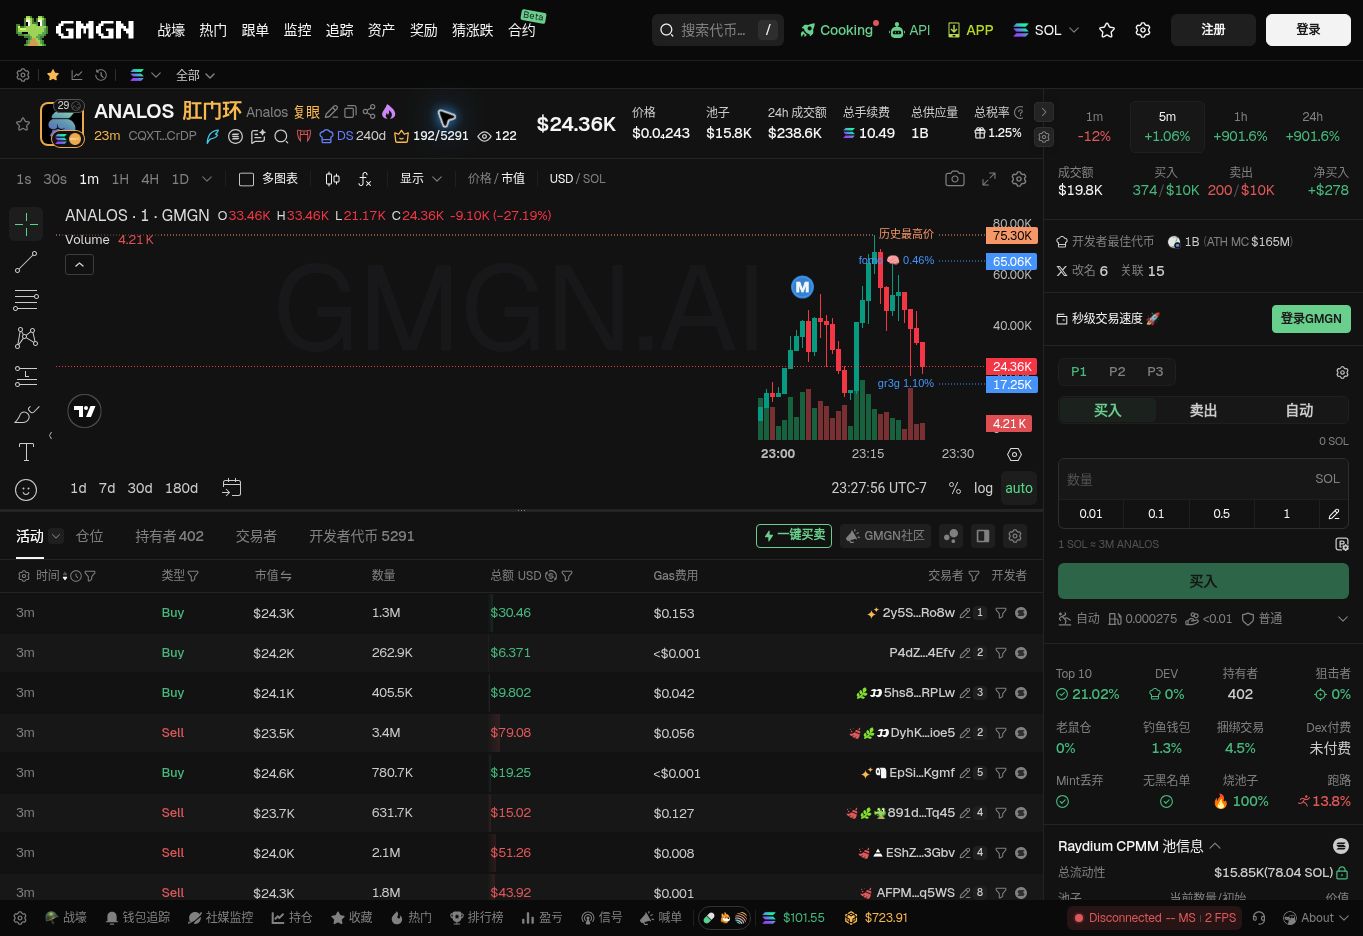
The panel shows Top 10 at 21.02%, insider holdings at 0% and Bundler at 4.5%. These figures describe different groups. Adding them together will not give you a meaningful risk score.
What the insider percentage measures
GMGN’s insider holdings percentage measures the share of a token’s total supply held by wallets the platform classifies as insiders. Suppose a token has a total supply of 100 million, and those wallets hold 10 million between them. The figure would be 10%. It would not mean that one in ten holders is an insider, or that the token has a 10% chance of a rug pull.
Why look at the label? Some wallets hold tokens without a recorded purchase after trading began. That raises a question worth following up: did the wallet receive an airdrop, or were the tokens transferred from another address? Similar funding paths and timing across several wallets warrant a closer look. You still need evidence before concluding that they belong to the project team.
The 0% shown in the screenshot also needs that context. It reflects GMGN’s classification at the time. It does not establish who controls every wallet or rule out connections the platform has not identified.
Were those purchases submitted together?
A bundle groups transactions for execution. Under Jito’s mechanism on Solana, transactions within a bundle execute in sequence and on an all-or-nothing basis: they all succeed, or none of them are committed to the chain. GMGN’s bundler labels help identify wallets involved in this kind of activity.
Imagine seeing several wallets buy a token in quick succession. It might look like a group of unrelated traders independently deciding to buy. If the purchases were submitted in the same bundle, that interpretation needs more scrutiny. Look at how much the wallets acquired, whether they later sold and what other connections appear in their funding and token transfers.
On the desktop page we checked, hovering over the Chinese “捆绑交易” label opened a tooltip describing the metric as a bundler holdings percentage. The 4.5% in this panel therefore concerns holdings; it does not mean that 4.5% of trading volume came from bundles. Other data tools have volume-based fields with similar names, so check the definition before comparing figures. Bundling itself is a transaction mechanism. Its presence alone does not establish fraud.
A low Top 10 figure leaves questions unanswered
Top 10 measures concentration among the largest ten holders counted by the platform. Check how the display treats pool addresses and other special-purpose addresses. A list of wallets cannot, by itself, tell you how many independent people control them. An apparently dispersed balance still warrants a look at connections between addresses; a transfer connection, in turn, needs to be understood in light of what those addresses are used for.
After checking the summary figures, open the Holders tab, labelled “持有者”, below the chart. Our GMGN beginner’s guide explains the surrounding layout if you are new to it.
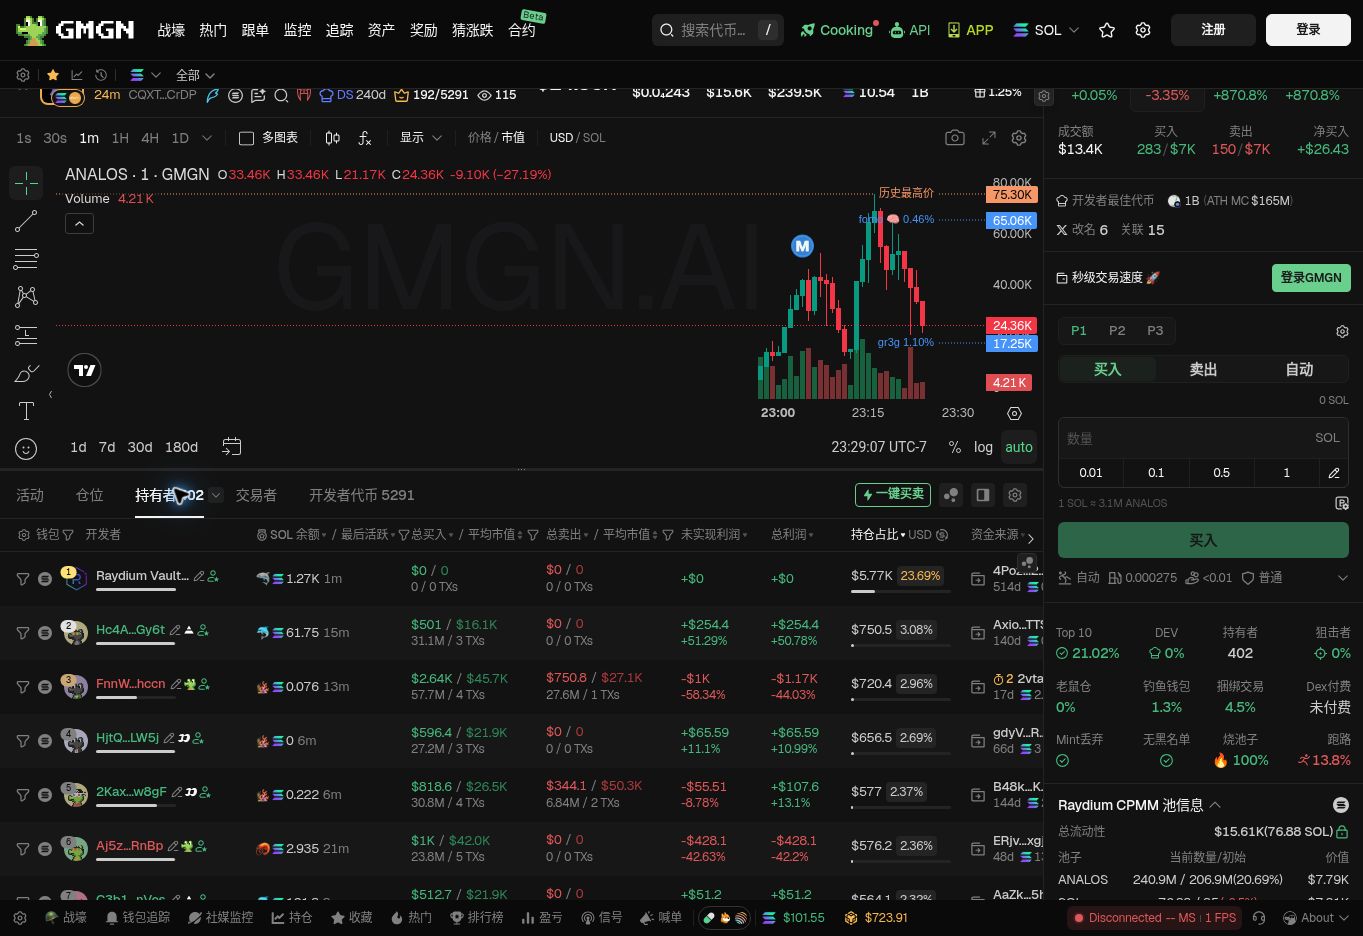
The first row is labelled Raydium Vault and relates to the liquidity pool. Do not read it as an individual trader’s position. For ordinary wallets, compare total purchases, total sales and the tokens still held.
Take the highlighted row. It shows roughly $2,640 in purchases, $750.80 in sales and a remaining holding of 2.96%. According to this table, the wallet has sold some tokens and still holds a position. Looking only at the sales could make a partial exit look like a full one. Looking only at the remaining balance could hide the fact that selling has already taken place.
To investigate further, read the individual transactions. Distinguish purchases from incoming transfers, and sales from transfers out. A falling balance does not always mean the wallet cashed out. If your question is why you lost money copying a profitable wallet, our article on why copy-trading returns differ explains the role of execution prices and fees.
The next time someone posts a spectacular meme-coin gain, you will have more useful questions to ask. Where did the holders get their tokens? How much do they still own? Does the transaction history support the story being told? Following those questions through the holder table gives you something more concrete to work with than a screenshot of a rising price.
← Back to Upwell Insights