If you spend time in Chinese crypto communities, you’ll eventually see someone call a fast-rising token a ‘jingou’. The word comes with screenshots of huge gains and stories about early buyers. But what does it actually tell you about the token?
Jingou literally means ‘golden dog’. In Chinese crypto slang, it describes a token that has delivered outsized gains for some early buyers. It isn’t an official classification, and there’s no agreed threshold: one person might use it for a token that has tripled, while another means a 100-fold rise. You’ll also find the term in GMGN’s Chinese meme-trading guide.
The label describes a success story from someone else’s starting point. An early buyer who sold may have made a fortune; someone who arrived later may have bought near the peak. To understand more than the hype, you need to look at the token’s trading data.
Start with the token, then check the numbers
You might come across a new token on a launch platform such as Pump.fun, in a group chat, or on a data and trading platform such as GMGN. A shared screenshot is a useful starting point, but it leaves out context. Open the original page and check the chain, full token address and time period before comparing the figures.
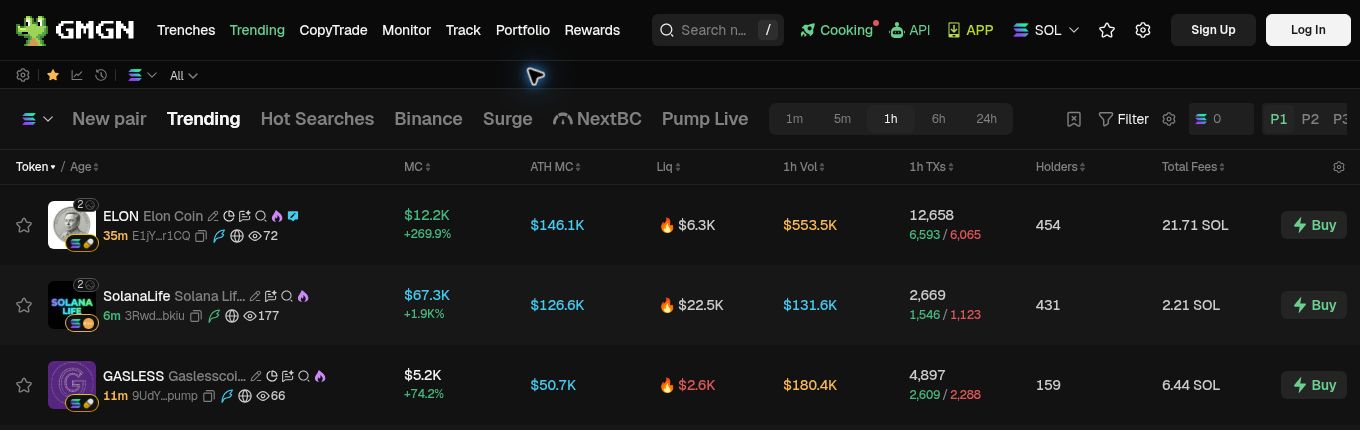
In the table above, start with Age, then look at Liq (liquidity), 1h Vol (one-hour trading volume) and 1h TXs (one-hour transaction count). A token created a few minutes ago has very little trading history. The selected time window matters too: an hour of activity and a day of activity tell different stories. GMGN’s Trending guide explains the columns.
High volume means a large value of trades took place during the selected period. It doesn’t mean that much fresh money entered the market: the same tokens can change hands repeatedly. Transactions aren’t the same as traders, either, because one wallet can trade many times. And the number of holder addresses isn’t a count of independent people; one person can control several wallets.
Market cap is different from liquidity
Market capitalization, usually shortened to market cap or MC, multiplies a token’s price by a measure of its supply. Check which supply figure the platform uses. The result is a valuation, not a record of how much money people have put in or how much they could all take out.
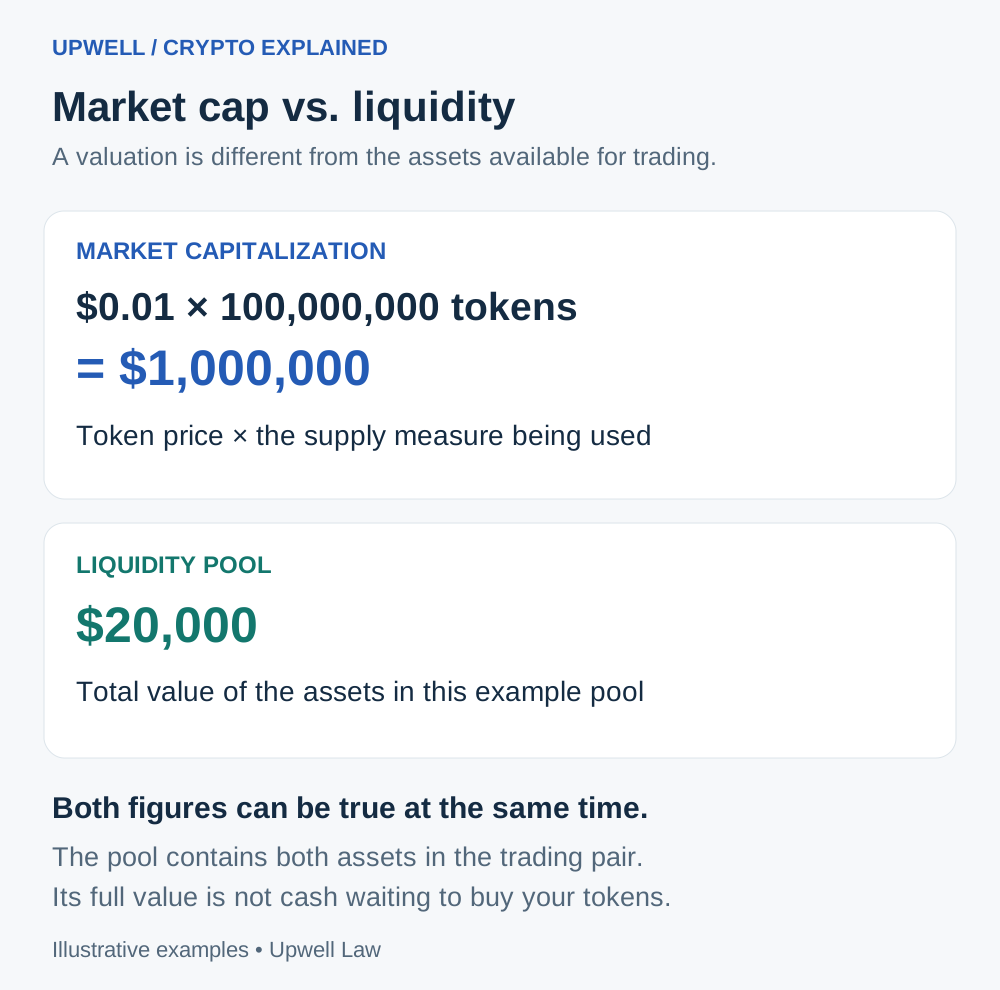
A liquidity pool holds the assets used to carry out trades. Its size and how its liquidity is distributed affect the prices available to buyers and sellers. A large sell order in a shallow pool can push down its own execution price. That’s why multiplying your holdings by the last quoted price may overstate what you could receive from selling them. Uniswap’s price-impact guide explains this relationship.
What a profit screenshot leaves out
When you see the next ‘jingou’ screenshot, check when it was taken, which token address it refers to and how much liquidity was available. Then ask what the return actually measures: the highest price reached, the current value of an unsold position, or profit from tokens already sold? Those are three different things.
None of these checks predicts the next breakout token. They do help you work out what happened—and whether the headline gain reflects a trade someone could actually complete.
← Back to Upwell Insights