You buy the same token as a successful trader, follow their sell, and still lose money. How does that happen? Buying the same asset doesn’t give you the same trade: your entry price, number of tokens, exit price and fees determine your own result.
The example below shows how those differences add up. All times and prices are hypothetical. They don’t represent a real wallet’s performance or measure the speed of GMGN’s copy-trading service.
A later entry buys fewer tokens
At 10:00, a trader buys a token at an average execution price of $0.10. You follow at 10:01, but your average execution price is $0.14. You each spend $1,000 on tokens and pay fees separately. The trader gets 10,000 tokens. You get about 7,142.86.
At 10:05, the trader sells the whole position at an average price of $0.15. You sell at 10:06, by which time your average execution price is $0.12. It’s the same token, but each of you has bought and sold at different prices.
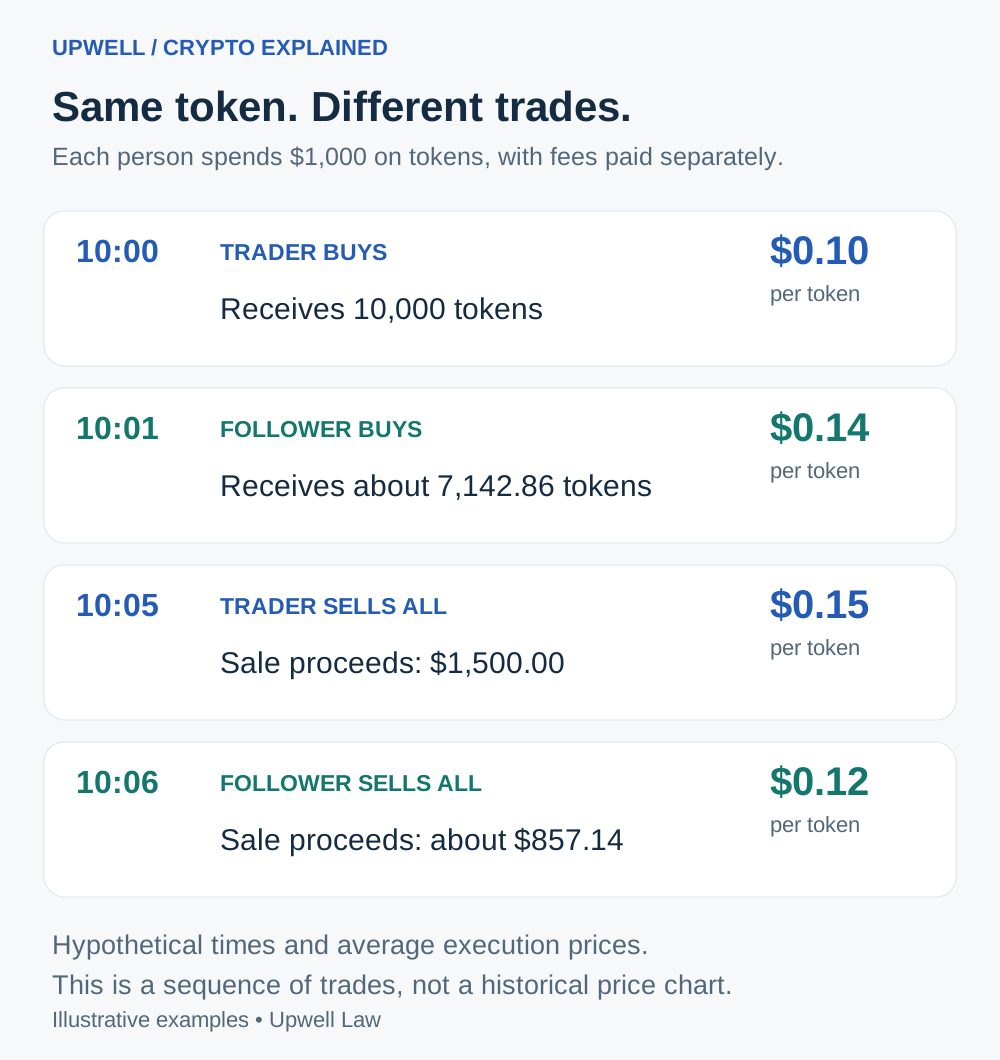
The trader’s 10,000 tokens sell for $1,500: a $500 profit before fees. Your roughly 7,142.86 tokens sell for about $857.14: a loss of about $142.86. The token rose after the trader bought it, but your own sale price was below your own entry price.
Add fees to see the net result
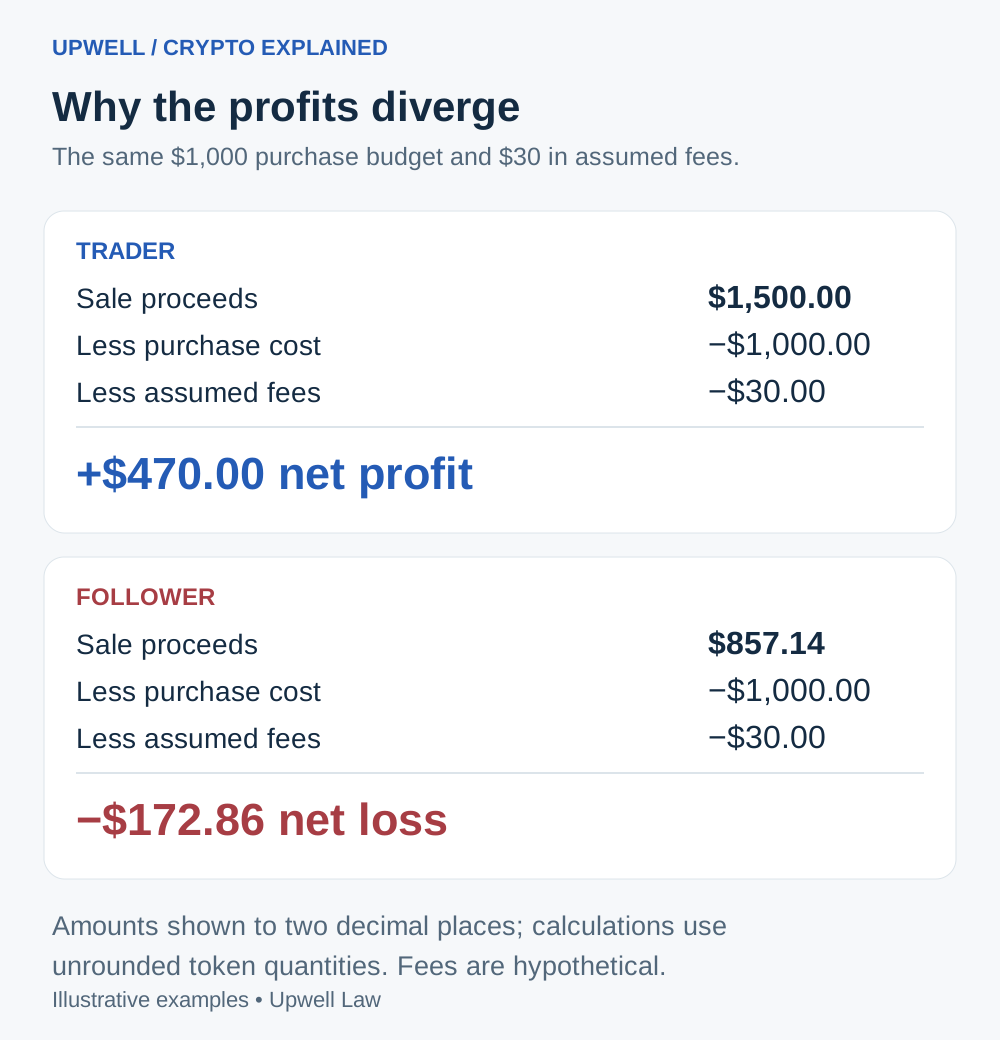
Now suppose each of you pays $30 in total fees across the purchase and sale. The trader’s net profit is $470. Your net loss is about $172.86. The $30 is an assumption for this example, not a platform’s published fee. For a real trade, use the on-chain and platform fees actually charged.
Understand slippage and price impact
Slippage is the difference between the price you expect and the price at which a trade executes. Price impact is the effect of your own trade on the market price. A large order in a pool with limited liquidity can move the price against you. That means execution differences can come from more than the time it takes to follow a signal. Uniswap explains the distinction.
The example above already uses average execution prices. Any difference between the quote and the fill is therefore reflected in the purchase cost or sale proceeds. Don’t subtract slippage again as a separate fee, or you’ll count the same effect twice.
Look beyond a single buy or sell
A buy alert doesn’t necessarily mark the start of a position. The trader may be adding to tokens bought much earlier at a lower price. A sell may close only part of the position, and the balance you see now may be what remains after several profitable exits. Tokens transferred into a wallet can further complicate the picture: a transfer isn’t automatically a purchase.
To understand the result, put purchases, additional buys, transfers and sales in chronological order. Check what remains and how much of the reported profit is unrealized. For your own trades, record when you saw the signal and compare the quote at that moment with the execution price you actually received.
Copy-trading tools can help you track and respond to another wallet’s activity. Your return still depends on the trades you complete. Before comparing profits, compare the full position history, execution prices and fees. That’s where the difference usually becomes visible.
← Back to Upwell Insights